
When I started out tinkering with exploit development, I would have loved to receive some help on how to set up a good exploit development environment. For those of you who have tried exploit development before, know that there is a lot of trial and error involved, hence repeating actions as fast as possible and with as little manual work makes the process much more effective. In this blog post I want to share my exploit development environment and explain how I have configured it.
I use the following applications in this environment:
- Python
- VMware Workstation / Player
The Basics
First off is the operating system and the application. In this blog post I am going to use 32 bit Internet Explorer on Windows 10. Many applications are different and not everything can be directly reused, but often the method can be reworked. First, create a Windows 10 32 bit virtual machine and update it to whatever patch level you want. Next install Windows Debugger, Python and Sublime Text 3 on the virtual machine.
With everything installed the configuration begins, first, let us set up everything outside the debugger. Since we are debugging Internet Explorer we are going to run our proof of concepts in the form of HTML pages. To load these pages in Internet Explorer we are going to need a web server, to make it as simple as possible we can use Python to set up a webserver for this. This is done by opening a command prompt, creating a directory for the HTML pages and navigate to it. Then we start the web server using the following command:

Remember to accept the firewall warning and allow Python to use port 80 the first time it is executed.
Next is Internet Explorer itself, when running a lot of iterations of the exploit, we will be loading a HTML file with the same name many times. Due to caching in the browser this will often load the old file, leading to many headaches. To avoid this open Internet Explorer and go to Internet Options:

Then click Settings and choose “Every time I visit the webpage”

Internet Explorer will no longer load an old cached version of the webpage.
Setting Up The Debugger
Next, we want to start up the debugger, to make it as efficient as possible we are going to run it from the command line with a one-liner. The complete command looks like this:

This command has a lot of content, so let me break it down below:
The first part is running the Windows Debugger itself with some flags:
-g Skips initial breakpoints and launch the application
-G Skips ending breakpoints and closes the application
-o Debugs child processes
-hd Disables debug heap
-Q Does not prompt to save workspace on exit
The -hd flag is worth mentioning since an application run under the debugger will have extra metadata in its heap. This is fine when debugging an application, however, for creating an exploit it is not good since the heap must have the same content and layout as when running without a debugger.
The second part of the command is specifying the application to debug and in this case also the webpage to open with Internet Explorer.
When the command is run the following layout of Windows Debugger will be seen:
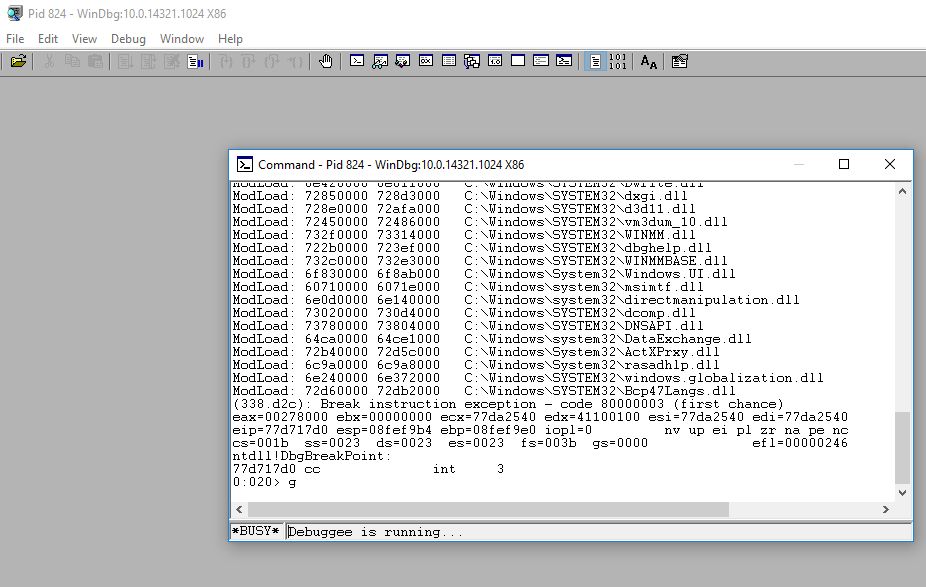
This is not a very good environment for debugging and some customization should be done. In the View menu, there are several windows available. It is possible to open as many as you want and use the snap-in feature to have them on the same screen. I prefer the Command, Disassembly and Call Stack windows as seen below:

Remember to chose to save the workspace when making changes since the -Q flag was specified any changes not manually saved are removed when the debugger is restarted. When the interface is set up, the next step is to enable the usage of scripted breakpoints. The way I do that is by adding an event filter set to module load. To go forward you must first break the application from the debugger. Then go to Debug -> Event Filters and choose the jscript9 module as argument and setting the Commands option to the file where the breakpoints are placed as shown below:

This causes the content of the file to be executed inside Windows Debugger when jscript9.dll is loaded into the process. The basic content of the bp.txt file I use looks like the following:

The concept is to use Javascript functions which are no commonly used in an exploit to produce debug information. The way I do it is by using four functions:
- Math.Atan is used as a debug break, which can be placed inside the Javascript code.
- Math.Atan2 is used as a debug print statement.
- Math.Cos is used to enable the lower breakpoints
- Math.Sin is used to disable the lower breakpoints
The breakpoints at the bottom record when allocations and deallocations take place, that is useful when looking into Use-After-Free exploits or for leaking some allocation during development.
To test it out I launch the following webpage:

When run it gives the output below:

This sums up the exploit development environment that I use, I hope this is useful.